Economics
Pareto (80/20)
You sit down on Sunday to plan the week. The list is long. It has emails, errands, meetings, and ideas. You look back at last week and notice something plain. Two clients brought in almost all the revenue. One feature request caused most of the bug reports. Three people on your team answered nearly every urgent message. When you fixed one thorny issue, angry tickets stopped. The rest of the work helped, but only a little. The same pattern shows up in your closet and your browser tabs.
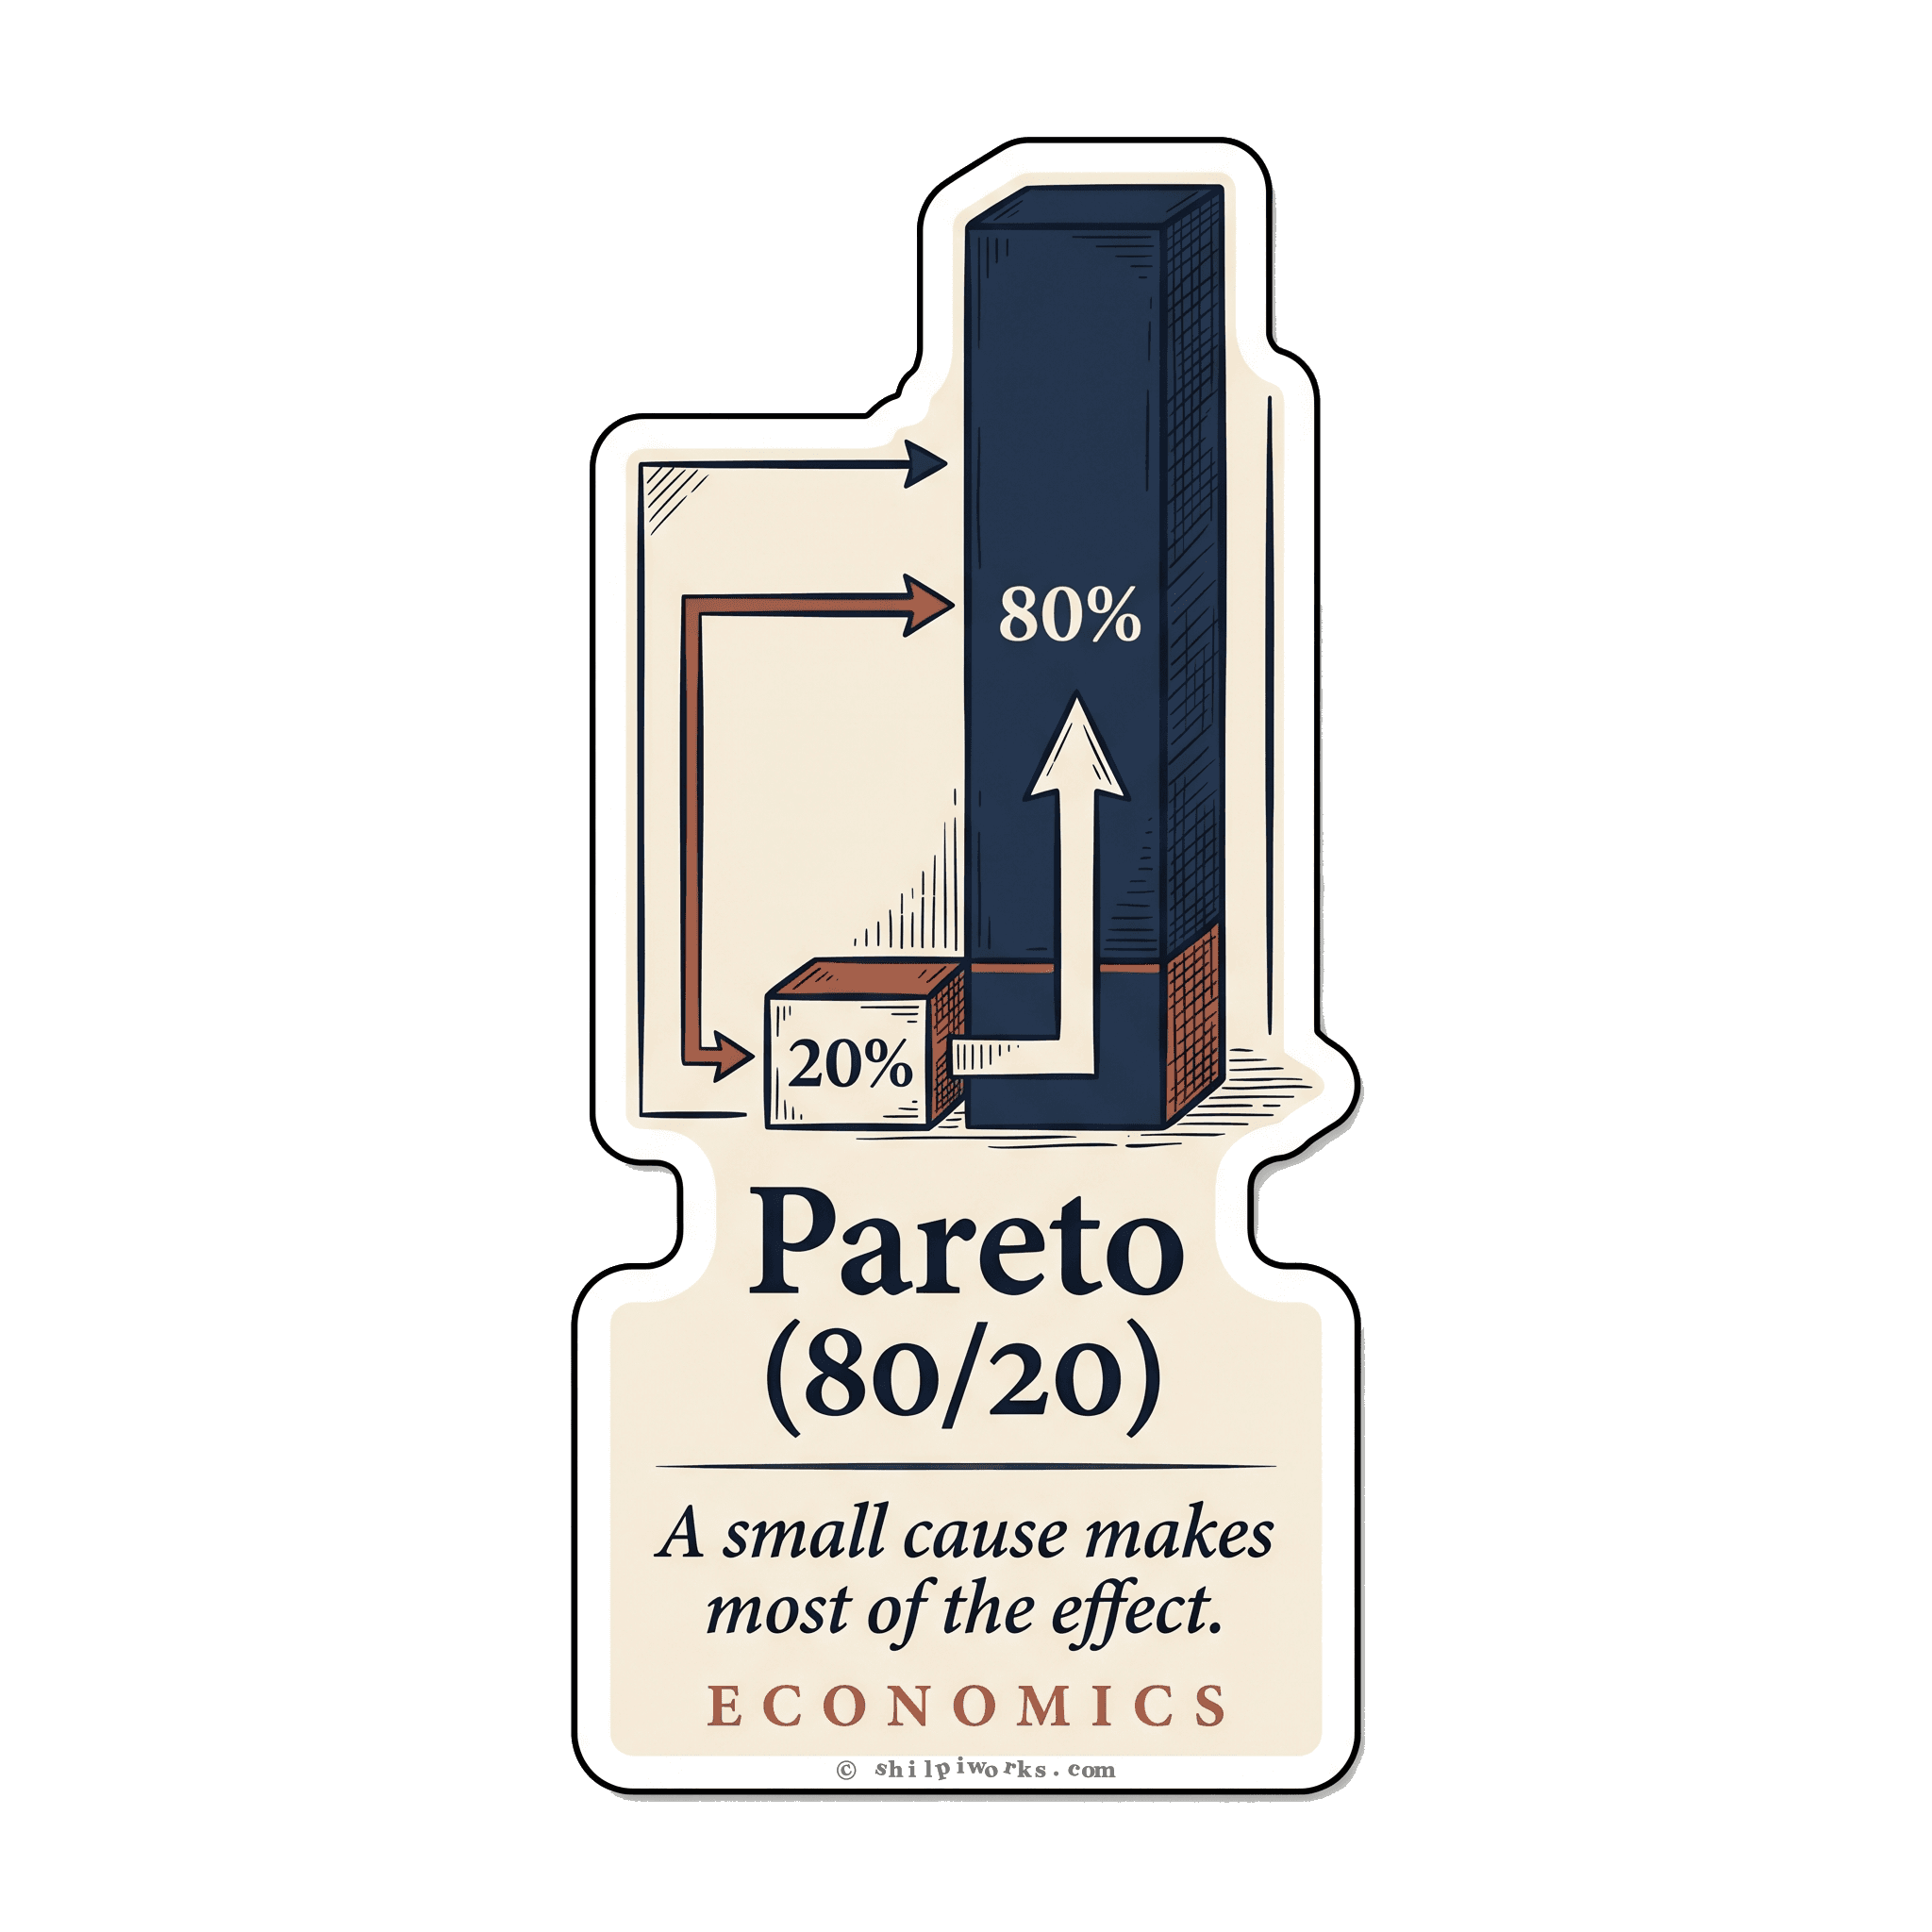
Results do not spread out evenly. A small share of inputs often creates most of the output. Revenue comes from a few customers, and complaints come from a few bugs. You wear the same few clothes most days. The rest still counts, but it moves little compared with the tall bar.
Therefore
List your inputs and rank them by effect. Spend real time on the top few and shrink or drop the tail.
Pareto, 1896
Vilfredo Pareto, an Italian economist teaching in Lausanne in 1896, studied tax and property records from Italy. He drew a curve of how much land each slice of the population owned. About twenty percent of Italians held roughly eighty percent of the property. He kept checking other countries and saw the same pattern, even when the numbers shifted a bit. He published the work in Cours d’économie politique, and the curve later took his name. Decades later, Joseph Juran used Pareto’s idea at Western Electric in Chicago, showing that a small group of defect types caused most failures and training managers to fix those first.
A small reminder, on a task list or calendar, that a few inputs create most progress and trimming the rest frees time to double down.
$3.50
2.5 inches vinyl · weatherproof · ships in 1–3 days
Mix & save: 3 for $9 · 5 for $14 · 10 for $25· free shipping at ten
- Weatherproof vinyl
- Ships from Wayzata in 1–3 business days
- Secure checkout
If anything is wrong, we'll refund or replace it. Read the policy